NanoChat Speedrun, Part 2: What the Run Actually Printed
Eight predictions, one H100 node, and a log file that answered most of them in the first forty lines.

Disclosure: I used AI assistance to edit and refine this post, but the ideas, interpretations, and conclusions are mine.
Part 1 ended with a table of eight things I expected to see. I had not rented a GPU at that point. The whole list came out of reading NanoChat and working through the arithmetic on paper.
This post is what happened when I ran it.
The short version: the model trained for 196.49 minutes on four H100s at 59.79% MFU, reached a validation bpb of 0.7194, and the instance bill came to about $41. Seven of the eight expectations held. The eighth held too, but only once I was honest about which step I was measuring.
What I did not expect was how quickly it would be settled. I had imagined careful post-hoc analysis. In practice, four of the eight predictions were resolved by line 373 of the log, before a single training step had run.
—
Making the expensive part boring
The one thing I was sure of before starting: I did not want to be learning cloud plumbing while a GPU meter was running.
Renting four H100s means the clock starts the moment the instance boots and does not stop for mistakes. So everything that could be rehearsed on cheap hardware got rehearsed there, and everything that could be automated got automated. The design goal was that the expensive run should be the least interesting part of the day.
Three decisions carried most of that weight.
The container holds code, not data. The Vast image was built with the runtime and the repository, nothing else. Datasets and checkpoints are large, they change independently of the code, and baking them in would have meant rebuilding the image for every data change. Instead the container starts, brings up SSH, and idles until told what to do.
Generated artifacts sync to Google Drive; downloaded ones do not. Anything the run produced — tokenizer, checkpoints, logs, report — was pushed to durable storage in the background. Anything that could be re-downloaded from the source was not. This distinction matters more than it sounds: a fresh host could restore the expensive, irreplaceable things in under two minutes and then re-fetch the cheap, reproducible ones in parallel.
Orchestration ran locally. A local script drove the remote host, which meant the workflow was scriptable, resumable, and legible to an agent. Each stage wrote a status marker — STARTED, DONE — so progress was a file to read rather than a terminal to watch.
I will not pretend this was elegant on the first attempt. It took several iterations, and the iterations are why the final run was uneventful.
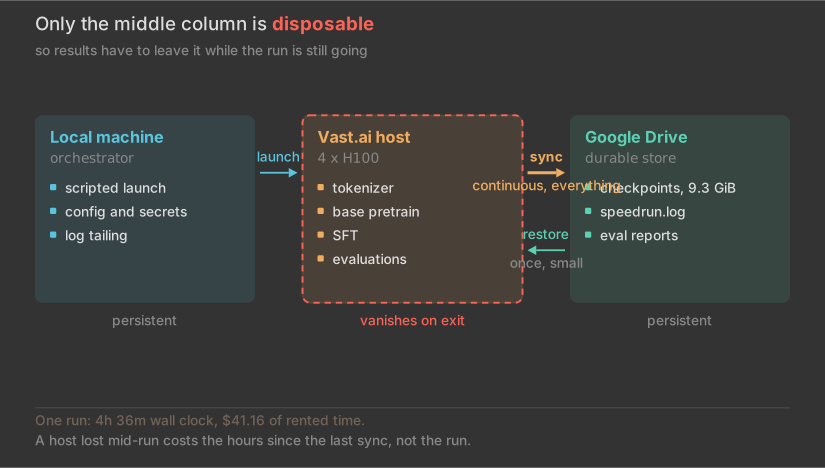
Three tiers, one of which vanishes. Restore runs once and moves very little; sync runs throughout and moves everything the run produces. Losing the host costs the hours since the last sync, not the run.
Everything before the run
Before any H100 was involved, the pipeline ran end to end on two RTX 3060s at depth 12. That configuration produces a bad model. That was never the point. The point was that every stage — tokenizer, base training, evaluation, SFT, chat evaluation, report generation — executed in order, wrote what it was supposed to write, and synced what it was supposed to sync.
Cheap hardware catches the whole class of failures that have nothing to do with scale: wrong paths, missing environment variables, a sync loop that silently uploads nothing, an evaluation stage that cannot find the checkpoint the previous stage wrote.
Then production blew up anyway.
The failures on H100 hardware were not code failures. They were operational: an SSH proxy that would not hold a connection, instances that idled while I worked out why. The billing screenshot from that day shows the debris — several instances at $5.32, $0.82, $0.17, $0.10, and two under a cent. None of them trained anything.
This is the part of the story that does not flatter anyone, so it is worth stating plainly: the code was never the problem. The problem was me learning someone else’s infrastructure at $2 an hour.
The run
The final run was tagged d24-4xh100-full: depth 24, four H100 80GB cards, FP8 enabled, started 2026-07-11 at 12:05:16.
Setup took about five minutes. Google Drive restore finished in 1.68 minutes, recovering the shared tokenizer and confirming there were no run-specific checkpoints to resume from. The dataset download then pulled 171 shards while the tokenizer was reused rather than retrained.
At 12:10:07 the training script initialised, and the log started answering questions.
Four predictions in forty lines
I had expected to do this analysis afterwards, with the log open in one window and Part 1 in another. Instead the initialisation block resolved four of the eight expectations before the first step.
Flash Attention 3. Line 342:
✓ Using Flash Attention 3 (Hopper GPU detected), efficient, new and awesome.
Expectation 5, settled. The Hopper gate worked exactly as the import chain said it would.
The depth cascade. Lines 343 to 368 printed the model configuration and the derived hyperparameters:
"n_layer": 24, "n_head": 12, "n_embd": 1536, "window_pattern": "SSSL"
Auto-computed optimal batch size: 1,048,576 tokens
Scaling LRs by 1.4142 for batch size 1,048,576 (reference: 524,288)
Scaling the LR for the AdamW parameters ∝1/√(1536/768) = 0.707107
Calculated number of iterations from target data:param ratio: 5,568
Total number of training tokens: 5,838,471,168
Expectation 1 was that --depth=24 would produce exactly these numbers. Every one matches what I derived from the formulas in Part 1. model_dim 1536, 12 heads, batch 1,048,576, LR scale 1.4142, AdamW scale 0.707107, 5,568 iterations.
The parameter table three lines above makes the derivation auditable in a way I had not anticipated. It reports transformer_matrices at 679,478,976 and lm_head at 50,331,648. Those sum to 729,810,624 — the scaling-parameter count the iteration formula depends on, printed as its own components rather than asserted as a total.
The batch math. Lines 371 to 373:
Tokens / micro-batch / rank: 16 x 2048 = 32,768
Tokens / micro-batch: 131,072
Total batch size 1,048,576 => gradient accumulation steps: 8
Expectation 2 was that running on four GPUs instead of the reference eight would change the accumulation count and nothing else. There it is: 1,048,576 ÷ 131,072 = 8. The global batch is a property of the experiment; the world size is a property of the hardware I happened to rent. The code keeps them separate, and says so out loud.
FP8 eligibility. Line 354:
✓ FP8 training enabled (tensorwise scaling) - converted 145/158 linear layers, skipped 13 (too small)
This is the one I had been most pleased with in Part 1, and the one I was most nervous about. I had counted the linear layers by hand from the module definitions, applied the eligibility filter from fp8.py, and predicted 145 conversions and 13 skips — twelve ve_gate projections at Linear(12, 12), where 12 is not divisible by 16, plus one smear_gate at Linear(24, 1).
The log prints 145/158 and 13. Expectation 3, exactly.
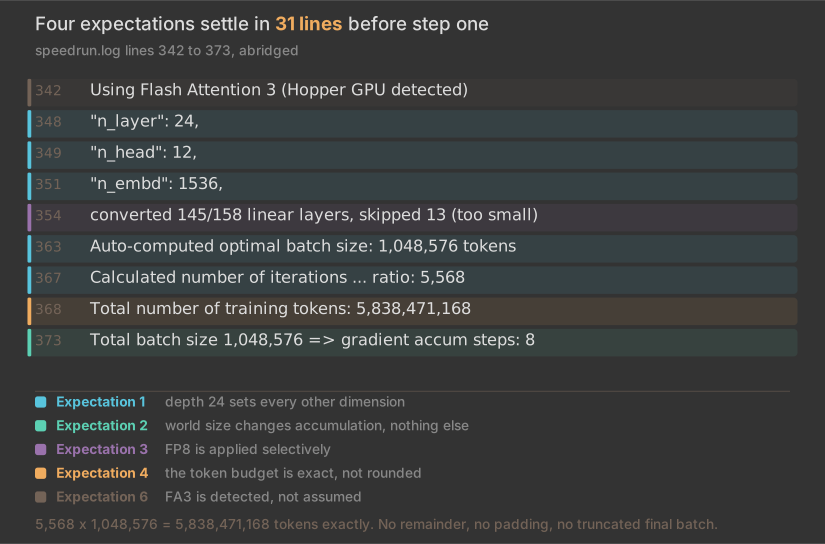
Lines 342 to 373 of the run log, abridged. Each printed value is tied to the Part 1 expectation it settles. Four of them resolve before step one, because the script says what it decided on its way up.
Watching it run
With four expectations already resolved, the remaining ones needed the run to finish. So I watched the step lines scroll.
They are almost boring, which turns out to be the finding:
step 00001/05568 | loss: 10.371374 | dt: 2108.35ms | tok/sec: 497,344 | bf16_mfu: 60.03
step 00002/05568 | loss: 10.325244 | dt: 2111.80ms | tok/sec: 496,531 | bf16_mfu: 59.94
step 00003/05568 | loss: 10.253621 | dt: 2117.46ms | tok/sec: 495,205 | bf16_mfu: 59.78
Step 1 is already at 60.03% MFU. Not step 500, not after some warm-up ramp. The second step of training.
The receipts that needed the whole run
Utilisation, honestly
Expectation 7 was the one I cared most about, and the one most easily fudged. The claim was not that MFU would be high. It was that it would be stable — that the headline number would not be a decent average hiding a bad distribution.
A single reported figure cannot answer that, so I pulled all 5,568 step lines out of the log and computed the distribution.
| Measure | All 5,568 steps | Excluding step 0 |
|---|---|---|
| Mean MFU | 59.65% | 59.66% |
| Standard deviation | 0.85 | 0.32 |
| Minimum | 0.92% (step 0) | 53.91% |
| Maximum | 60.92% | 60.92% |
| Samples below 50% | 1 | 0 |
Here is where I have to be careful, because the honest version of this claim is narrower than the flattering one.
Step 0 runs at 0.92% MFU. It is the compile step: torch.compile traces and builds kernels, which takes 137 seconds against roughly 2.1 seconds for every subsequent step. Including it in a stability measure inflates the standard deviation nearly threefold, from 0.32 to 0.85, on the strength of one sample that is not measuring steady-state throughput at all.
So the claim I will defend is the narrow one: across 5,567 steady-state steps, mean MFU was 59.66% with a standard deviation of 0.32, and not one of them fell below 50%. 98.6% of steps land within a single percentage point of the mean. Step 0 is excluded deliberately, and I am telling you that rather than quietly dropping it.
There is a detail I did not predict and would not have thought to look for. Splitting the run into quarters:
| Quarter | Mean MFU | Std dev |
|---|---|---|
| First | 59.51% | 0.35 |
| Second | 59.67% | 0.28 |
| Third | 59.68% | 0.29 |
| Fourth | 59.79% | 0.29 |
Utilisation does not sag as the run progresses. It drifts upward, monotonically, and the final quarter’s mean is 59.79% — which is the headline MFU the report quotes. The number in the report is not a flattering peak. It is where the run settled.
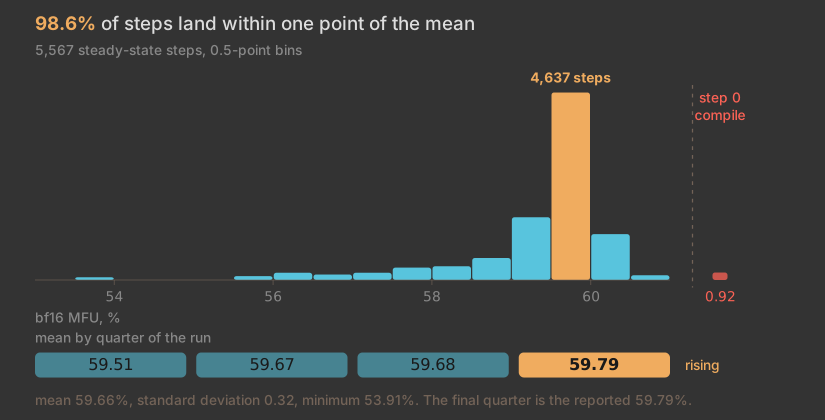
Every steady-state step, in half-point bins. 98.6% of them land within one point of the 59.66% mean. Step 0 sits at 0.92% and is drawn in its own lane so it cannot flatter the scale. The quarterly means rise and finish on the reported 59.79%.
What the hardware reported about itself. Everything above is the training script’s own arithmetic: bf16_mfu is a number NanoChat computes and prints. WandB also samples the GPUs directly through NVML, on its own schedule, independent of the training loop. It is the only instrument in this run that is not NanoChat marking its own homework.
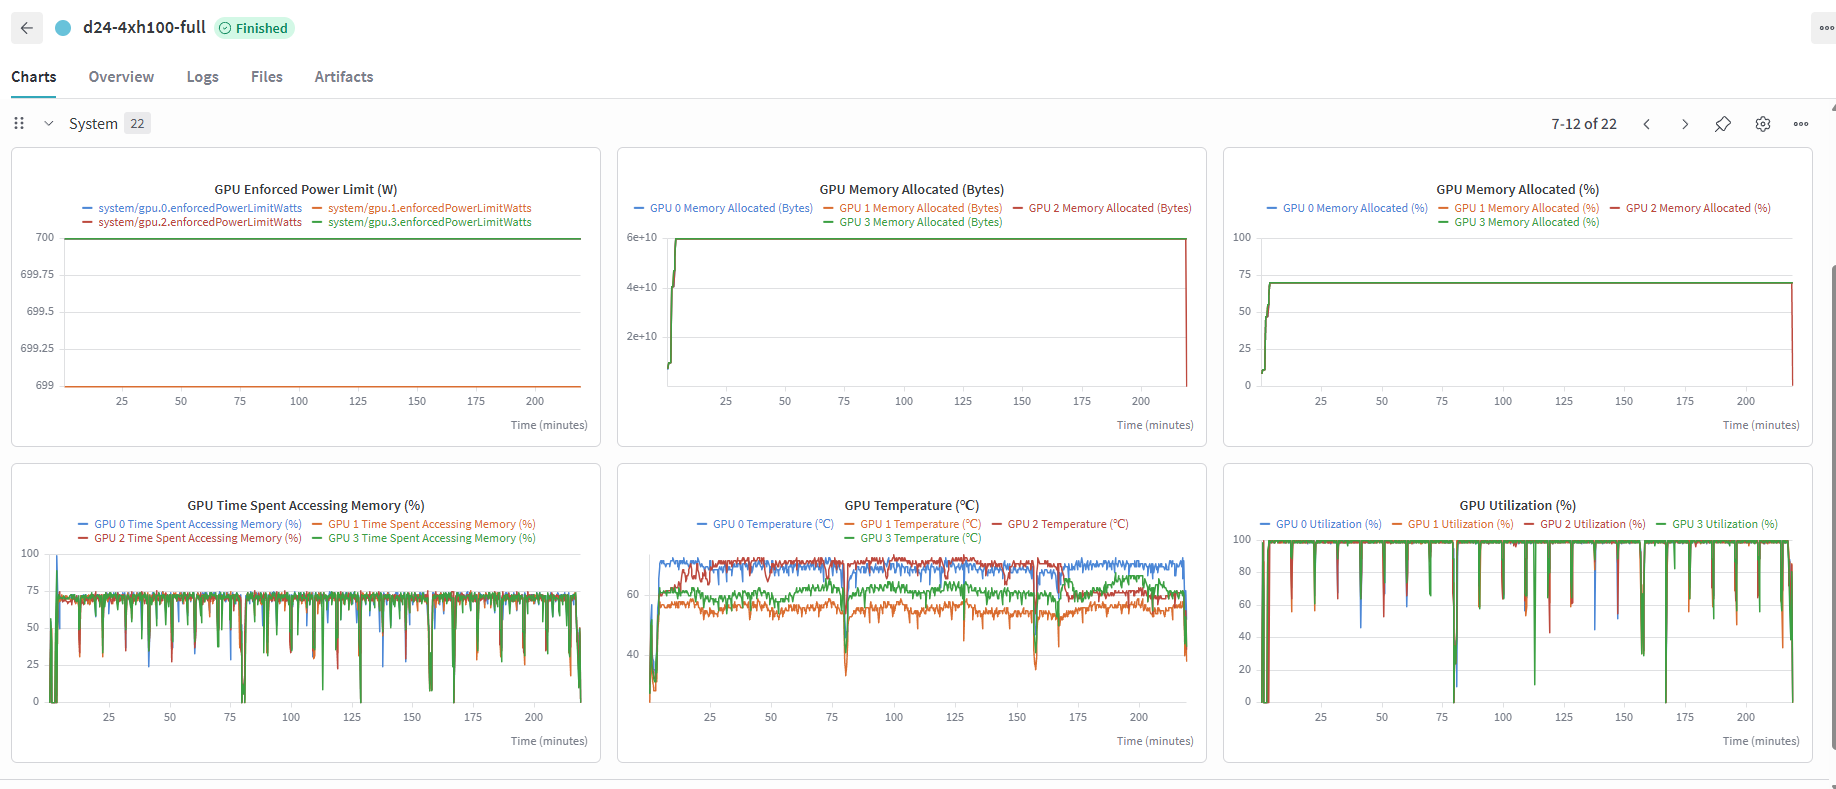
Six NVML panels for all four GPUs. Top row: enforced power limit flat at 700W, memory allocated flat at 60 GB and 70.2%. Bottom row: memory-access time, temperature, and utilisation, each showing the same regular sawtooth.
Utilisation sits at 99–100% for essentially the entire run. That rules out something I had not thought to check: host-side starvation. If the data loader had ever fallen behind, or if Python had opened gaps between steps, the GPUs would have gone idle and it would show here as a dip. Across 3.27 hours, they did not.
The regular dips are my favourite detail in the whole run. Every nine to ten minutes, utilisation falls, memory traffic drops away, and all four GPUs cool by several degrees before climbing straight back on the next sample. That is the validation pass: the log runs one every 250 steps, which is 8.85 minutes of training time, and the pass itself accounts for the rest of the gap. There are three deeper drops as well, and the run contains exactly three full CORE evaluations — though the log excludes evaluation time from its own clock, so I could not line the timings up closely enough to call that proven. The regular sawtooth I am sure of. You can read the evaluation schedule off the temperature of the silicon.
The flat panels are quietly reassuring in a different way. The enforced power limit holds at 700W throughout, so these were full-power SXM cards that were never quietly capped. Temperatures sit between the mid-fifties and low seventies, nowhere near throttling. Memory allocation climbs to 60 GB about four minutes in and never moves again — 70.2% of each card, which implies 79.6 GiB of total capacity and confirms these were the 80 GB H100s I thought I had rented. Flat for 5,568 steps, 24 validation passes and 3 full evaluations also means nothing leaked.
One thing this does not settle, and I want to be explicit because the chart invites the wrong conclusion. Utilisation counts time with a kernel resident on the device, not time doing useful work, and NCCL collectives are kernels too. A run whose communication blocked would look much the same here. This corroborates the flat MFU; it does not prove the overlap.
The arithmetic that proves there is no padding
Expectation 4 was about the data loader: that BOS-aligned best-fit packing fills every row exactly, with no padding anywhere.
This one has a proof rather than a measurement, and it is my favourite thing in the log.
The run reports 5,568 iterations and a global batch of 1,048,576 tokens. It separately reports the total tokens trained as 5,838,471,168.
5,568 × 1,048,576 = 5,838,471,168
Exactly. No remainder, no rounding, no discrepancy of a few thousand tokens that would indicate a padded final row or a dropped partial batch. Every token counted in the total is a real token that contributed to a gradient.
That is what “no padding, ever” looks like when you can check it with multiplication.
Half the GPUs, twice the time
Expectation 6 was that base training would be largely GPU-bound, so running on four cards instead of the reference eight should take roughly twice as long.
NanoChat’s README reports 1.65 hours for base training on an 8×H100 node. My run reports:
Total training time: 196.49m
That is 3.27 hours. Against 1.65, the ratio is 1.98×.
Two percent off perfect linear scaling, on half the hardware. I want to be careful about what this does and does not show: it is one data point at one configuration compared against a published number from a different machine, not a scaling study. But it is consistent with the design reading from Part 1 — that this path is single-node and compute-bound, and that the communication is arranged so it does not become the limit.
What it cost
The successful instance shows $41.16 on the Vast.ai billing page for 11 July. Including the smoke tests and the failed H100 attempts from the same day, the practical total was about $47.58.
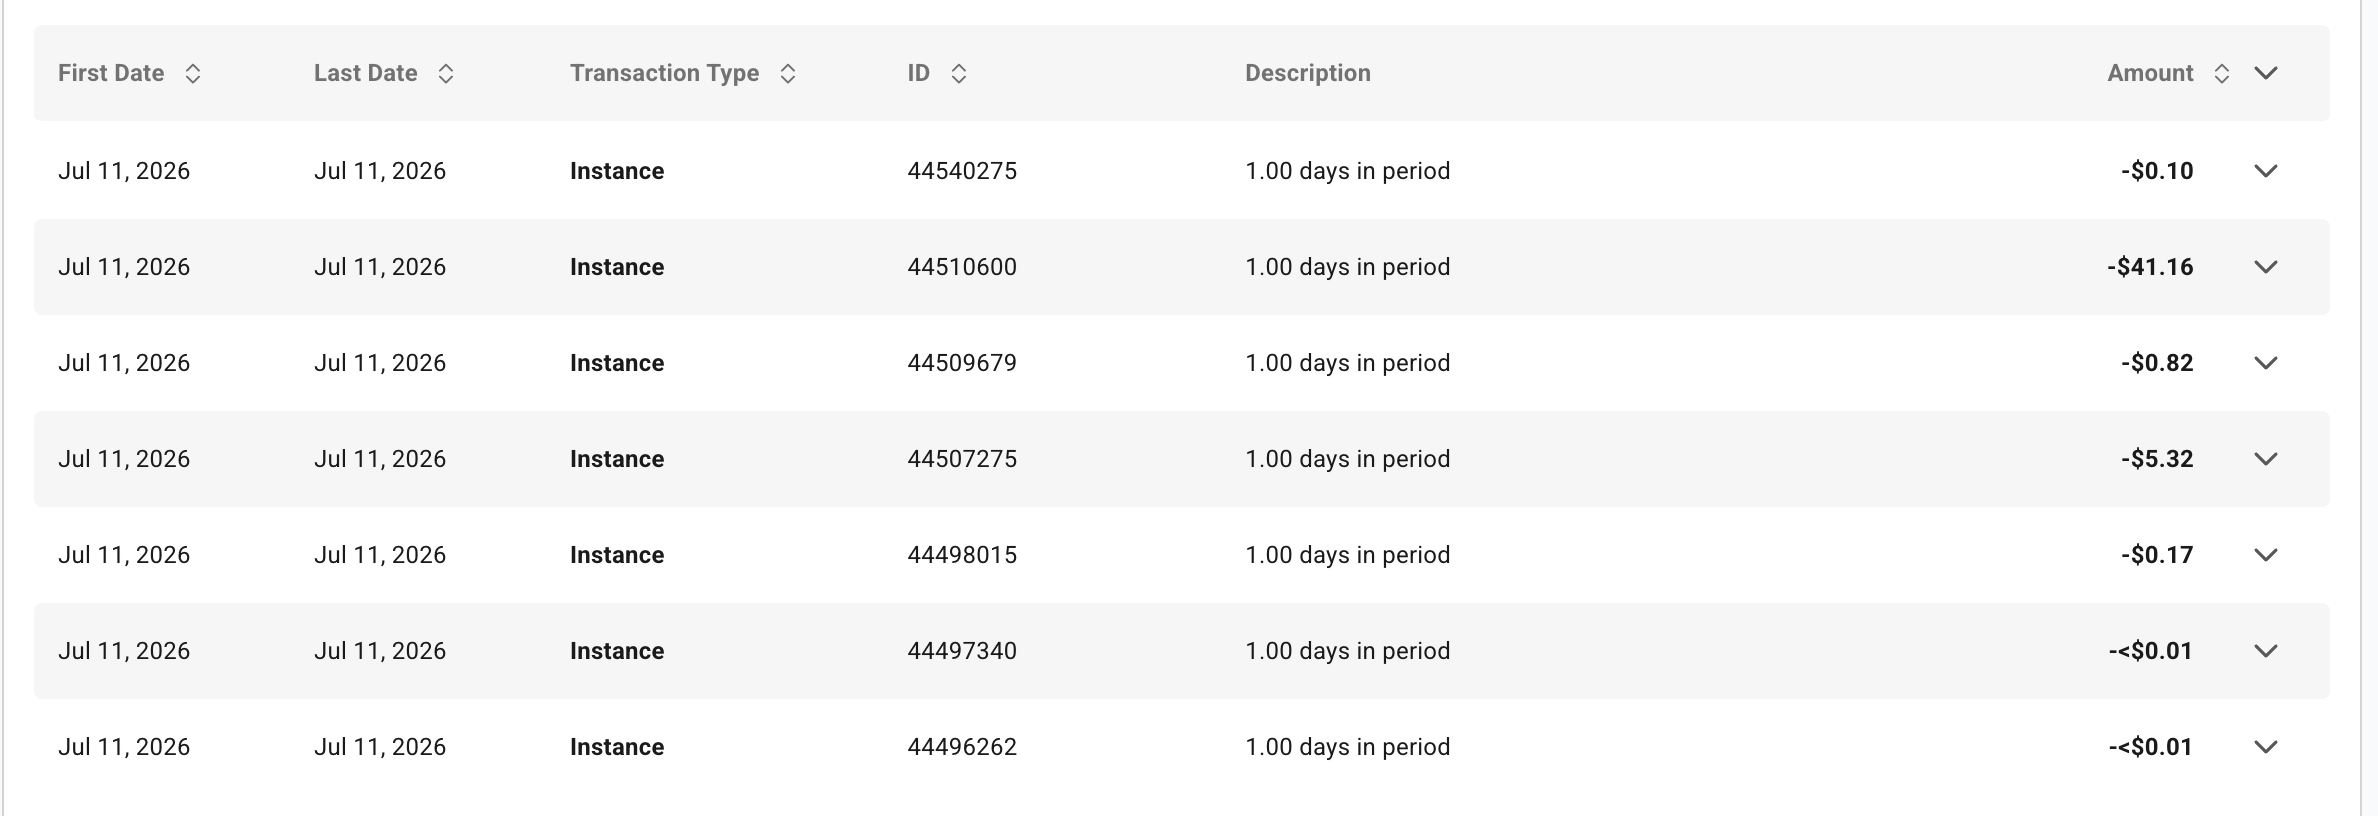
The Vast.ai charges. The successful run sits alongside the debris from the attempts that did not get there, which is the honest version of the number.
The $100 line from the original GPT-2 speedrun framing is comfortably clear either way, and that was expectation 8.
The honest caveat: I am inferring which billing row corresponds to the final run from the timing and the amount. The instance identifiers are not stamped in the training log. The $41.16 row is by far the most likely candidate — it is the only charge consistent with a four-hour four-GPU session — but I have not proved the mapping, and I would rather say so than present it as certain.
The part of the bill that is not GPU time
One operational detail worth surfacing, because it surprised me.
A checkpoint is not one file. Rank 0 writes the model and metadata; every rank writes its own optimizer shard. After the run, the Google Drive metadata showed:
- Base checkpoint set: 9.283 GiB across 6 objects
- SFT checkpoint set: 9.283 GiB across 6 objects
- Model file
model_005568.pt: 4,227,935,530 bytes - Each of four optimizer shards: 1,434,912,917 bytes
My naive estimate had been 2 bytes per parameter for bf16 weights — about 2.77 GB for 1.38 billion parameters. The actual model file is over 4 GB, because a checkpoint carries more than a flat dump of parameter bytes.
This is why artifact sync ran continuously in the background rather than as a final step. Roughly 18.5 GiB of checkpoints moving to durable storage at the end of a run is not a rounding error on a rented machine. Getting that wrong means paying for GPU time while a network transfer finishes.
Talking to it
None of the above is why anyone trains a model.
After SFT and chat evaluation, there is a model you can hold a conversation with. It is not good. It is a 1.4-billion-parameter model trained on 5.8 billion tokens for three hours, and it will confidently tell you things that are not true.

Fluent, well formed, on topic, and wrong about things it has no way to know. Both halves of that sentence matter.
But it answers in fluent, well-formed English, follows the shape of a conversation, and stays on topic. Its ChatCORE score is 0.3712 and its CORE is 0.2561, against 0.2626 for the reference 8×H100 run — close enough that the difference is not the story.
The story is that the thing talks back, and it cost $41.
The tokenizer joke
One failure is worth keeping, because it is funny and because the lesson is real.
At one point I loaded a checkpoint with the wrong tokenizer. The model was fine. The weights were fine. Every token index was being decoded against the wrong vocabulary, so the output was confident, fluent, perfectly-structured nonsense.
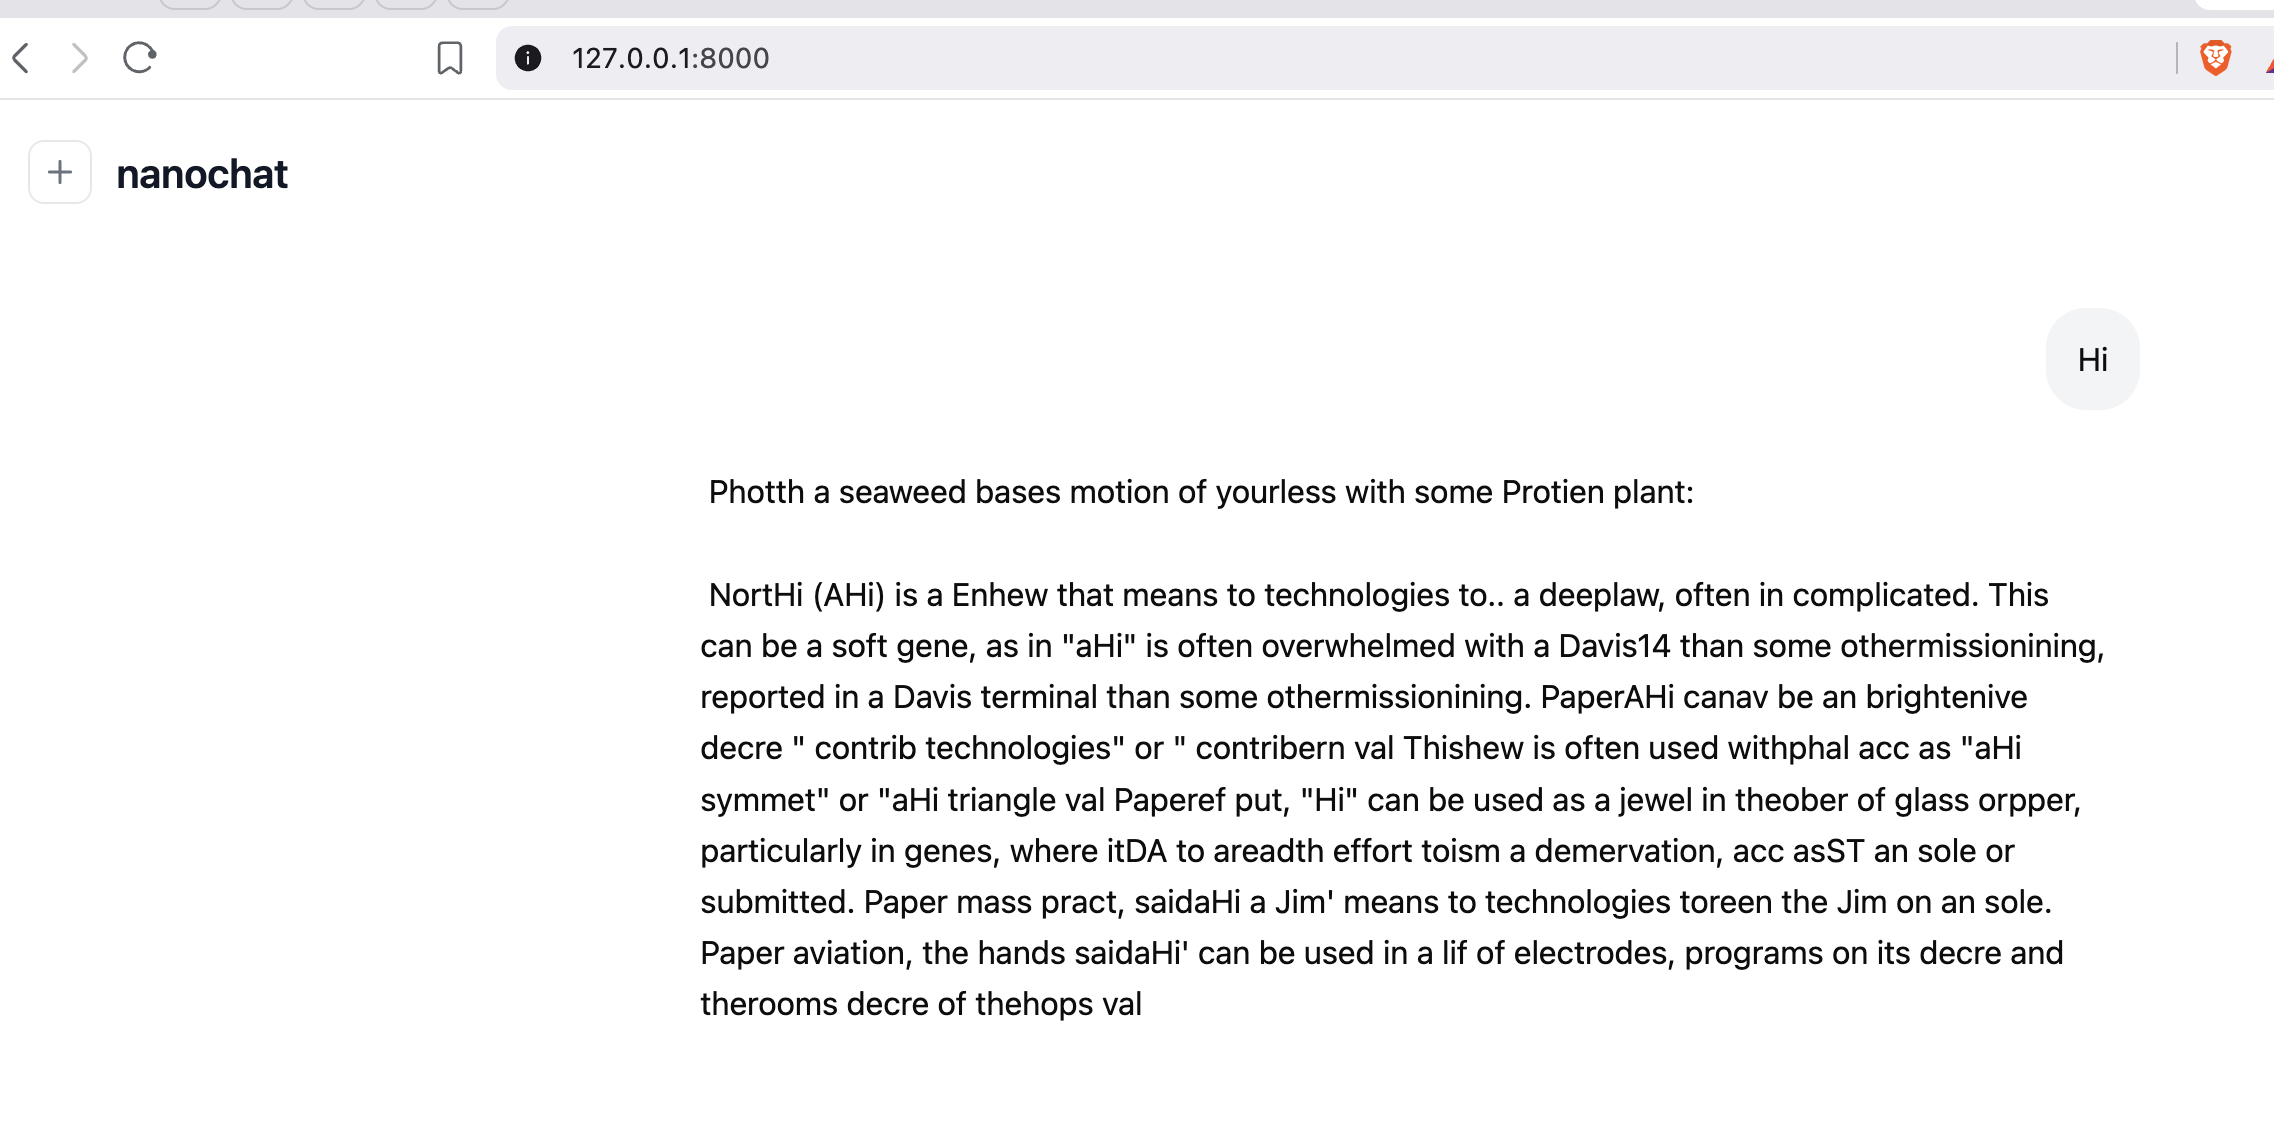
The same checkpoint with a mismatched tokenizer. It has the cadence and punctuation of language right up until you try to read it.
It is a good reminder that a checkpoint is not self-describing. Weights plus the wrong vocabulary is not a degraded model; it is a different one. Ship the tokenizer with the checkpoint, or you have shipped an artifact that cannot be used.
What held up, and what I never tested
Eight expectations. Here is the accounting.
| # | Expectation | Verdict |
|---|---|---|
| 1 | --depth=24 derives dim 1536, 12 heads, batch 1,048,576, 5,568 iters, 5.84B tokens |
Held — all printed verbatim |
| 2 | Four GPUs changes accumulation to 8, not the global batch | Held — log states it explicitly |
| 3 | FP8 converts exactly 145 of 158 layers, skipping 13 | Held — exact match |
| 4 | Total tokens is exactly 5,568 × 1,048,576 | Held — arithmetic, no remainder |
| 5 | FA3 activates on H100 and says so | Held |
| 6 | Half the GPUs, roughly twice the time | Held — 1.98× |
| 7 | Utilisation high and stable | Held, scoped — 0.32 stdev over 5,567 steady-state steps |
| 8 | Lands well under the $100 line | Held — about $41 |
Now the part that matters more than the table.
I did not validate the optimizer design. Part 1 argued that moving communication into an explicit async optimizer phase is what keeps utilisation flat. Flat MFU and pinned GPU occupancy are both consistent with that, and neither can distinguish it from communication that blocks, because the collectives occupy the device either way. I have no profiler trace, no comparison against a DDP-wrapped baseline, and no measurement isolating the communication phase. The claim remains a reading of the code that the results do not contradict.
I did not measure the attention windows. SSSL is confirmed in the config, and the code says 18 of 24 layers see only 512 tokens. I never instrumented attention to watch it happen.
I did not reproduce the dataset comparison. NanoChat’s claim that ClimbMix cut the reference run by 27% over FineWeb-EDU is the repository’s measurement, not mine. I ran one dataset once.
I did not test the scaling laws. Same boundary as Part 1. I confirmed the code implements what it claims; whether D^0.383 is the right exponent needs sweeps I did not run.
One run does not establish reproducibility. It establishes that on 11 July 2026, on this hardware, the code did what a careful reading said it would.
What I actually learned
I went in expecting to check a stack. What I ended up checking was whether a piece of engineering means what it says.
The satisfying part was not that the predictions held. It was how they held. The log does not report a batch size; it reports the micro-batch, the per-rank tokens, and the resulting accumulation count, so you can verify the arithmetic yourself. It does not report a parameter count; it reports the components, so the scaling-parameter figure the iteration formula depends on can be reconstructed. It does not claim no padding; it prints two numbers whose product proves it.
That is a deliberate choice, repeated often enough that it cannot be accidental. The code is written to be checked. Someone decided that a reader who wanted to verify a claim should be able to, and then did the unglamorous work of printing the intermediate values that make verification possible.
Reading the code was rewarding. Watching it print exactly what the reading predicted — four times over, in forty lines, before training started — was better.
The model it produced is small and often wrong. The engineering that produced it is neither.
Notes and sources
- Run:
d24-4xh100-full, 4× NVIDIA H100 80GB HBM3, 11 July 2026. The report and the fullspeedrun.logare in my fork, under blog/evidence/part-1. - MFU statistics computed from all 5,568 base-training step lines in
speedrun.log. Step 0 excluded from steady-state figures, as stated above. - GPU telemetry is sampled by Weights & Biases through NVML, outside the training loop. It is not something NanoChat logs.
- Reference comparison figures (1.65 h, CORE 0.2626) are from NanoChat’s own README leaderboard row, not a run of mine.
- Andrej Karpathy, NanoChat.